The talib package ships with a charting system built
on two backends: plotly (interactive, default) and
ggplot2 (static). Charts are composed in two steps:
create a price chart with chart(), then layer on indicators
with indicator().
Getting started
chart() takes any OHLCV object coercible to a
data.frame. The package includes three built-in
datasets—BTC, NVDA, and SPY—used
throughout this vignette.
The chart title defaults to the name of the object passed to
x. Override it with the title argument.
Chart types
Two chart types are supported via the type argument:
"candlestick" (default) and "ohlc".
Adding indicators
Use indicator() to attach technical indicators to the
most recent chart(). Indicators that overlay on price
(e.g., Bollinger Bands, moving averages) are drawn on the main panel.
Indicators with their own scale (e.g., RSI, MACD) are drawn in
sub-panels below.
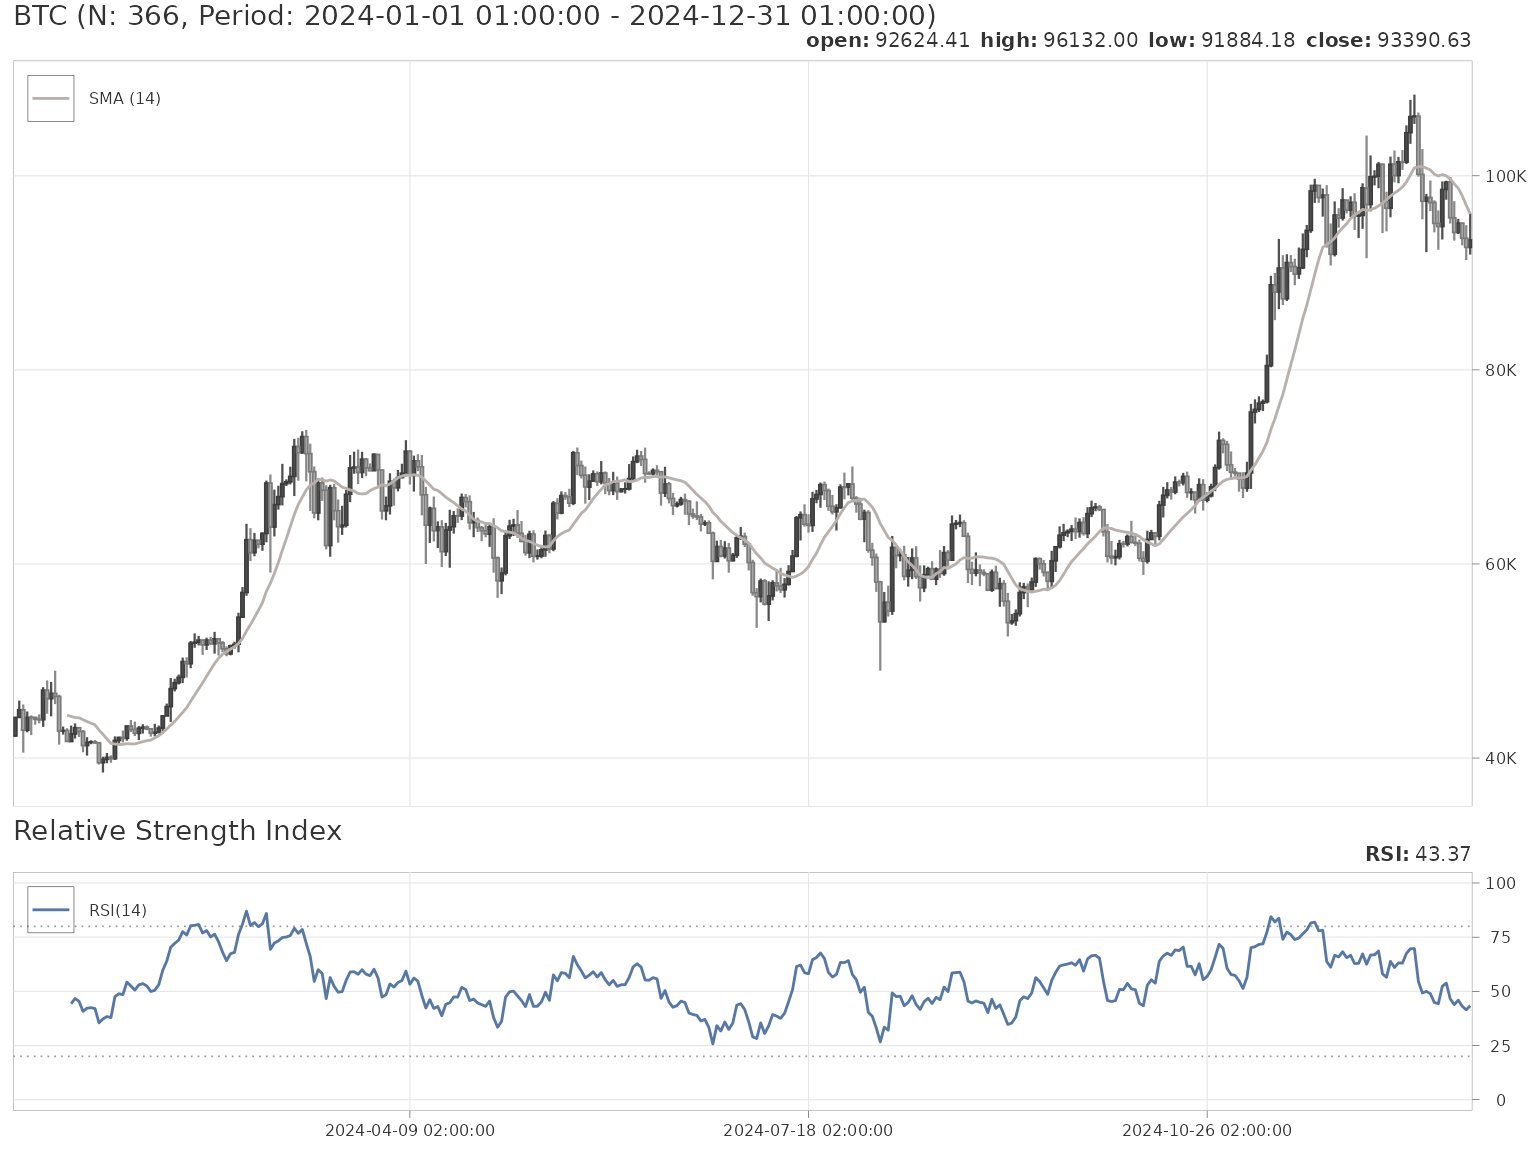
{
  talib::chart(talib::BTC)
  talib::indicator(talib::SMA, timePeriod = 7)
  talib::indicator(talib::SMA, timePeriod = 14)
  talib::indicator(talib::RSI)
}
Multiple sub-panel indicators stack vertically. The main chart
occupies 70% of the height by default (controlled by
talib.chart.main).
{
  talib::chart(talib::BTC)
  talib::indicator(talib::BBANDS)
  talib::indicator(talib::MACD)
  talib::indicator(talib::trading_volume)
}
Combining indicators on one panel
By default, each sub-panel indicator (RSI, MACD, etc.) gets its own
panel. To merge multiple indicators onto the same panel, pass them as
calls to indicator():
{
  talib::chart(talib::BTC)
  talib::indicator(
    talib::RSI(timePeriod = 10),
    talib::RSI(timePeriod = 14),
    talib::RSI(timePeriod = 21)
  )
}
Each indicator keeps its own arguments and receives a distinct color from the active theme’s color palette. This works with any number of indicators—and they don’t have to be the same type:
Combined panels and regular panels can be freely mixed in the same chart:
{
  talib::chart(talib::BTC)
  talib::indicator(talib::BBANDS)
  talib::indicator(
    talib::RSI(timePeriod = 10),
    talib::RSI(timePeriod = 14),
    talib::RSI(timePeriod = 21)
  )
  talib::indicator(talib::MACD)
}
Note: the syntax matters.
indicator(RSI, timePeriod = 14)passes a function and arguments separately (single indicator).indicator(RSI(timePeriod = 14), RSI(timePeriod = 21))passes calls (combined panel). A single call likeindicator(RSI(timePeriod = 14))also works and is equivalent to the single-indicator form.
Standalone indicators
If no chart() has been called, indicator()
can plot an indicator on its own—but you must supply the
data argument explicitly.
X-axis labels
Internally, the charting system uses integer positions
(1:nrow(data)) on the x-axis for efficient alignment
between the main chart and sub-panels. By default, the axis shows these
integer positions or the row names of the data.
Pass a vector to the idx argument to display custom
labels (e.g., dates).
Subsetting indicators
The subset argument lets you apply an indicator to a
specific range of the data without subsetting the data itself. This is
useful for comparing different indicators across different time
windows.
Themes
The package includes a theme system that controls candle colors,
background, text, grid, and the color palette used for indicator traces.
Eight built-in themes are available; three of them
(bloomberg_terminal, limit_up,
bid_n_ask) are designed to remain distinguishable under the
most common color-vision deficiencies. See ?chart_themes
for the full accessibility breakdown.
Setting a theme
Use the $ accessor on set_theme for
tab-completion, or pass the theme name as a string.
## equivalent ways to set a theme
talib::set_theme$payout
talib::set_theme("payout")

## list available theme names
talib::set_theme()
Themes persist across charts until changed. Set the theme
before calling chart().
Hawks and Doves
A light theme with neutral grays.
{
  talib::set_theme$hawks_and_doves
  talib::chart(talib::BTC)
  talib::indicator(talib::SMA, timePeriod = 7)
  talib::indicator(talib::SMA, timePeriod = 14)
  talib::indicator(talib::SMA, timePeriod = 21)
  talib::indicator(talib::SMA, timePeriod = 28)
  talib::indicator(talib::MACD)
  talib::indicator(talib::trading_volume)
}
Payout
A dark theme with teal and orange accents.
{
  talib::set_theme$payout
  talib::chart(talib::BTC)
  talib::indicator(talib::SMA, timePeriod = 7)
  talib::indicator(talib::SMA, timePeriod = 14)
  talib::indicator(talib::SMA, timePeriod = 21)
  talib::indicator(talib::SMA, timePeriod = 28)
  talib::indicator(talib::MACD)
  talib::indicator(talib::trading_volume)
}
TP Slapped
A bright theme with teal and red candles on a light background.
{
  talib::set_theme$tp_slapped
  talib::chart(talib::BTC)
  talib::indicator(talib::SMA, timePeriod = 7)
  talib::indicator(talib::SMA, timePeriod = 14)
  talib::indicator(talib::SMA, timePeriod = 21)
  talib::indicator(talib::SMA, timePeriod = 28)
  talib::indicator(talib::MACD)
  talib::indicator(talib::trading_volume)
}
Trust the Process
A light, muted theme with earthy tones.
{
  talib::set_theme$trust_the_process
  talib::chart(talib::BTC)
  talib::indicator(talib::SMA, timePeriod = 7)
  talib::indicator(talib::SMA, timePeriod = 14)
  talib::indicator(talib::SMA, timePeriod = 21)
  talib::indicator(talib::SMA, timePeriod = 28)
  talib::indicator(talib::MACD)
  talib::indicator(talib::trading_volume)
}
Bloomberg Terminal (colorblind-friendly)
A dark theme inspired by the Bloomberg Terminal interface. Orange bullish candles paired with neutral-gray bearish candles — the orange/gray pair separates cleanly under deuteranopia, protanopia, and tritanopia. The colorway is the Okabe-Ito qualitative palette.
{
  talib::set_theme$bloomberg_terminal
  talib::chart(talib::BTC)
  talib::indicator(talib::SMA, timePeriod = 7)
  talib::indicator(talib::SMA, timePeriod = 14)
  talib::indicator(talib::SMA, timePeriod = 21)
  talib::indicator(talib::SMA, timePeriod = 28)
  talib::indicator(talib::MACD)
  talib::indicator(talib::trading_volume)
}
Limit Up (colorblind-friendly)
A dark monochrome theme that encodes direction with luminance only. Light-gray bullish candles vs dark-gray bearish candles — the contrast is large enough to remain unambiguous under all three CVD types and even under full achromatopsia.
{
  talib::set_theme$limit_up
  talib::chart(talib::BTC)
  talib::indicator(talib::SMA, timePeriod = 7)
  talib::indicator(talib::SMA, timePeriod = 14)
  talib::indicator(talib::SMA, timePeriod = 21)
  talib::indicator(talib::SMA, timePeriod = 28)
  talib::indicator(talib::MACD)
  talib::indicator(talib::trading_volume)
}
Bid n Ask (colorblind-friendly)
A light theme with the classic blue-vs-red trading pair. Steel-blue bullish and tomato-red bearish candles separate well under deuteranopia and protanopia (the most common CVD forms, affecting roughly 8% of males); separation under tritanopia is weaker but still readable.
{
  talib::set_theme$bid_n_ask
  talib::chart(talib::BTC)
  talib::indicator(talib::SMA, timePeriod = 7)
  talib::indicator(talib::SMA, timePeriod = 14)
  talib::indicator(talib::SMA, timePeriod = 21)
  talib::indicator(talib::SMA, timePeriod = 28)
  talib::indicator(talib::MACD)
  talib::indicator(talib::trading_volume)
}
Custom color overrides
Pass named color arguments to set_theme() to override
individual theme properties on top of a base theme.
{
  talib::set_theme(
    "payout",
    background_color = "#000000",
    bullish_body     = "#00FF00",
    bearish_body     = "#FF0000"
  )
  talib::chart(talib::BTC)
  talib::indicator(talib::RSI)
}
The full set of overridable properties: bullish_body,
bullish_wick, bullish_border,
bearish_body, bearish_wick,
bearish_border, background_color,
foreground_color, text_color,
threshold_color, gridcolor, and
colorway (a vector of up to 10 colors for indicator
traces).
Chart options
Global options control layout and display behavior. Set them with
options() before calling chart().
| Option | Default | Description |
|---|---|---|
talib.chart.backend |
"plotly" |
Charting backend: "plotly" or
"ggplot2"
|
talib.chart.slider |
FALSE |
Add a range slider below the x-axis (plotly only) |
talib.chart.slider.size |
0.05 |
Height proportion of the range slider |
talib.chart.legend |
TRUE |
Show the legend |
talib.chart.scale |
1 |
Font scale multiplier |
talib.chart.main |
0.7 |
Main chart height as a proportion of the total (when sub-panels are present) |
talib.chart.modebar |
NULL |
Show the plotly modebar
(TRUE/FALSE/NULL for auto) |
Static charts with ggplot2
Set talib.chart.backend to "ggplot2" for
static charts. This requires the ggplot2 package. The
API is identical—chart() and indicator() work
the same way.
{
  options(talib.chart.backend = "ggplot2")
  talib::set_theme$hawks_and_doves

  talib::chart(talib::BTC)
  talib::indicator(talib::SMA, timePeriod = 14)
  talib::indicator(talib::RSI)
}