Cryptocurrency Market Data with quantmod and TTR
Source:vignettes/articles/05-quantmod.Rmd
05-quantmod.Rmd
## load libraries
library(cryptoQuotes)
The cryptoQuotes were built with quantmod
and TTR in mind. To demonstrate how
cryptoQuotes works with these packages, we will use the
following data,
## Get daily
## Bitcoin from
## the spot market
BTC <- get_quote(
  ticker  = "BTCUSD",
  source  = "kraken",
  futures = FALSE,
  interval= "1d",
  from    = "2024-01-01"
)
Cryptocurrency and quantmod
The BTC can be passed into the charting functions, or be
used in the quantmod::tradeModel()-functions.
Building Cryptocurrency Trade Models
Below is an example on how to use the
quantmod::tradeModel with BTC,
## 1) specify
## the model
BTC_model <-  quantmod::specifyModel(
  quantmod::Next(quantmod::OpCl(BTC)) ~ quantmod::Lag(quantmod::OpHi(BTC),0:3)
  )
#> Warning in formula.character(object, env = baseenv()): Using formula(x) is deprecated when x is a character vector of length > 1.
#>   Consider formula(paste(x, collapse = " ")) instead.
## 2) build the
## model
built_model <-  quantmod::buildModel(
  x = BTC_model,
  method ='lm',
  training.per = range(head(zoo::index(BTC), 10))
  )

## 3) trade the model
quantmod::tradeModel(built_model,leverage=2)
#>
#>   Model:  lm1716033210.04428
#>
#>   C.A.G.R.:  29.58%  H.P.R.:  13.95%
#>
#>   Returns by period summary:
#>
#>              weekly monthly quarterly yearly
#>     Max.     25.77%  48.73%    31.94% 34.57%
#>     3rd Qu.   4.49%  25.44%    24.45% 34.57%
#>     Mean      2.13%   8.89%    16.97% 34.57%
#>     Median   -1.69%   1.88%    16.97% 34.57%
#>     2rd Qu.  -5.00% -12.93%     9.48% 34.57%
#>     Min.    -14.61% -18.69%     1.99% 34.57%
#>
#>   Period to date returns:
#>
#>              weekly monthly quarterly yearly
#>              25.04%  25.44%     1.99% 34.57%
Charting Cryptocurrency with quantmod
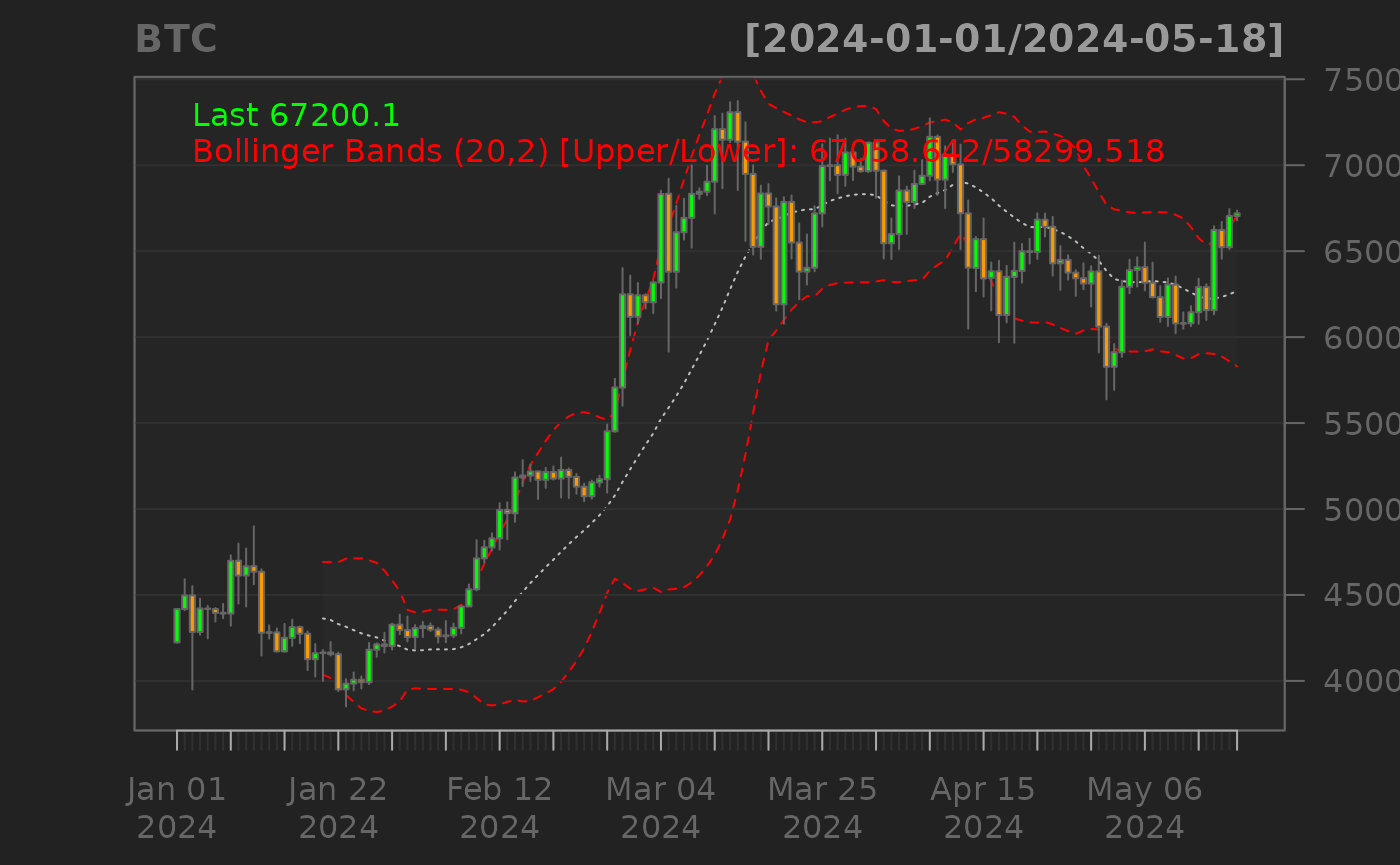
## chart the
## BTC with candlesticks
## and Bollinger BAnds
quantmod::chartSeries(
  x = BTC,
  type = "candlesticks",
  TA = c(
    quantmod::addBBands()
  )
)
Cryptocurrency and TTR
Below is an example on how to use the BBands()-function
from the TTR-package,
# 1) calculate
# Bollinger Bands
indicator <- TTR::BBands(
  quantmod::HLC(BTC)
)

# 2) add to the
# cryptocurrency quote
BTC <- cbind(
  BTC,
  indicator
)| Index | open | high | low | close | volume | dn | mavg | up | pctB |
|---|---|---|---|---|---|---|---|---|---|
| 2024-05-13 | 61444.6 | 63400 | 60773.2 | 62910 | 1728.049 | 59007.488 | 62380.203 | 65752.919 | 0.497 |
| 2024-05-14 | 62910 | 63075 | 61000 | 61568.6 | 1843.74 | 59063.903 | 62226.352 | 65388.8 | 0.445 |
| 2024-05-15 | 61568.6 | 66450 | 61325.4 | 66233 | 4260.469 | 59021.242 | 62250.948 | 65480.654 | 0.874 |
| 2024-05-16 | 66233.1 | 66700 | 64557 | 65228.4 | 2547.44 | 58873.539 | 62328.205 | 65782.871 | 0.958 |
| 2024-05-17 | 65228.4 | 67443 | 65121.1 | 67043.5 | 2179.142 | 58594.212 | 62493.088 | 66391.965 | 1.018 |
| 2024-05-18 | 67043.6 | 67362.9 | 66798.2 | 67200.1 | 325.869 | 58299.518 | 62679.08 | 67058.642 | 1.007 |