Cryptocurrency Market Data with {quantmod} and {TTR}
Source:vignettes/articles/05-article.Rmd
05-article.Rmd
## load libraries
library(cryptoQuotes)
{cryptoQuotes} were built with {quantmod} and {TTR} in mind. To demonstrate how {cryptoQuotes} works with these packages, we will use the following data,
## Get daily
## Bitcoin from
## the spot market
BTC <- get_quote(
  ticker   = "BTCUSD",
  source   = "kraken",
  futures  = FALSE,
  interval = "1d",
  from     = "2024-01-01"
)
Cryptocurrency and quantmod
The BTC can be passed into the charting functions, or be
used in the quantmod::tradeModel()-functions.
Building Cryptocurrency Trade Models
Below is an example on how to use the
quantmod::tradeModel()-function with the
BTC-object,
## 1) specify
## the model
lhs <- quantmod::Next(quantmod::OpCl(BTC))
rhs <- quantmod::Lag(quantmod::OpHi(BTC),0:3)

BTC_model <- quantmod::specifyModel(
  formula = lhs ~ rhs
)

## 2) build the
## model
built_model <-  quantmod::buildModel(
  x            = BTC_model,
  method       = 'lm',
  training.per = range(head(zoo::index(BTC), 10))
)

## 3) trade the model
quantmod::tradeModel(built_model, leverage = 2)
#>
#>   Model:  lm1771154600.02138
#>
#>   C.A.G.R.:  -27.78%     H.P.R.:  -15.78%
#>
#>   Returns by period summary:
#>
#>              weekly monthly quarterly  yearly
#>     Max.     22.70%  29.95%     9.42% -12.12%
#>     3rd Qu.   7.17%   9.42%     5.96% -12.12%
#>     Mean     -0.02%  -0.42%    -3.24% -12.12%
#>     Median   -2.51%   2.50%     2.50% -12.12%
#>     2rd Qu.  -8.38% -14.54%    -9.57% -12.12%
#>     Min.    -21.19% -29.44%   -21.64% -12.12%
#>
#>   Period to date returns:
#>
#>              weekly monthly quarterly  yearly
#>              17.33%   9.42%     9.42% -12.12%
Charting Cryptocurrency with {quantmod}
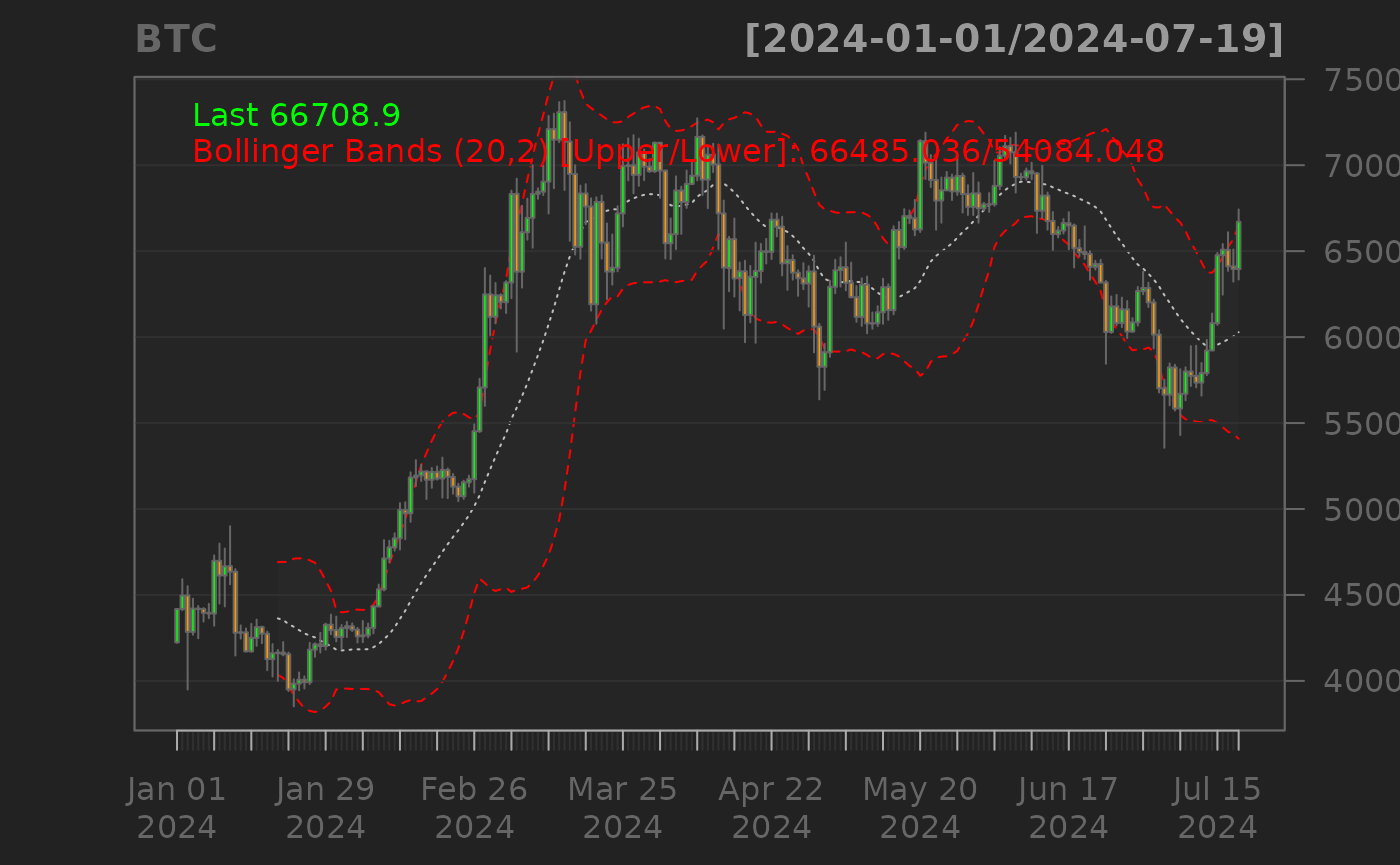
## chart the
## BTC with candlesticks
## and Bollinger BAnds
quantmod::chartSeries(
  x    = BTC,
  type = "candlesticks",
  TA   = c(
    quantmod::addBBands()
  )
)
Cryptocurrency and {TTR}
Below is an example on how to use the BBands()-function
from {TTR},
# 1) calculate
# Bollinger Bands
indicator <- TTR::BBands(
  quantmod::HLC(BTC)
)

# 2) add to the
# cryptocurrency quote
BTC <- cbind(
  BTC,
  indicator
)| index | open | high | low | close | volume | dn | mavg | up | pctB |
|---|---|---|---|---|---|---|---|---|---|
| 2024-07-14 | 59222.8 | 61373.5 | 59222.8 | 60810 | 1537.756 | 55169.562 | 59456.318 | 63743.075 | 0.618 |
| 2024-07-15 | 60810 | 64900 | 60704.5 | 64764.2 | 2989.713 | 55003.009 | 59555.733 | 64108.457 | 0.928 |
| 2024-07-16 | 64764.3 | 65416.3 | 62466 | 65088.7 | 3185.162 | 54749.989 | 59705.927 | 64661.864 | 0.966 |
| 2024-07-17 | 65077.1 | 66100.3 | 63853.1 | 64120 | 1952.563 | 54500.19 | 59865.557 | 65230.923 | 0.95 |
| 2024-07-18 | 64120.1 | 65097.1 | 63225.5 | 63960.7 | 1495.398 | 54366.588 | 60030.907 | 65695.225 | 0.859 |
| 2024-07-19 | 63960.7 | 67429 | 63350 | 66708.9 | 2068.886 | 54084.048 | 60284.542 | 66485.036 | 0.947 |